In the energy industry, few things are as critical and as misunderstood as process safety. While personal safety focuses on preventing slips, trips, and falls, process safety is about ensuring the success of critical operational steps. In simple terms, process safety is the disciplined framework for preventing workflow disruptions that could lead to major incidents.
These aren’t everyday events, but when they happen, the consequences are often devastating. That’s why process safety is so closely tied to Asset Integrity Management (AIM). If a facility is going to perform safely and operate as intended throughout its lifecycle, it must have strong, well-maintained safety barriers and clear Key Performance Indicators (KPIs). And just as importantly, it needs to know whether those barriers are working.
Key Performance Indicators (KPIs)
Key Performance Indicators (KPIs) are quantifiable metrics that assess how effectively an individual, team, or organization is achieving specific objectives. They provide measurable values that help track progress and inform decision-making to ensure alignment with strategic goals. They allow organizations to track why something went wrong and detect the early signs that barriers may be eroding. In this manner, operations can repurpose their process safety discipline from a reactive approach to a preventive one, but why is this so important for industrial facilities?
Why process safety is a must
KPIs give the process safety discipline a structured way to assess the system’s integrity, not just after things go wrong, but also to monitor the progression of goals and priorities. In this sense, a comprehensive process safety framework should contemplate a series of factors, such as:
Failure and Incident Prevention
Process safety focuses on managing risks related to the loss of primary containment (LOPC) of hazardous substances. Such events, like gas leaks or explosions, are typically the result of multiple barrier failures. These incidents are low frequency but have high consequences and cannot be prevented solely through occupational safety measures.
Asset Integrity Support
Asset integrity means that a facility is structurally and mechanically sound and operates within design limits throughout its lifecycle. Process safety ensures that critical safety barriers—both hardware (like pressure relief valves) and human (like operational procedures)—are identified, implemented, maintained, and continuously improved.
Compliance and Trust
Regulatory bodies increasingly require companies to demonstrate that their operations are not only compliant on paper but also effective in practice. A well-defined KPI framework provides the data required to support regulatory audits, incident investigations, and third-party assessments.
Establishing an Effective Process Safety KPI Framework
To achieve a robust Process Safety program, the International Association of Oil & Gas Producers recommends a four-tier system of KPIs. The system is divided into lagging indicators (Tiers 1 and 2) and leading indicators (Tiers 3 and 4):
- Lagging indicators show what has already gone wrong. They’re reactive.
- Leading indicators track the conditions that could lead to failure. They’re proactive.
In this context, industries must establish a customized KPI system with four clearly defined tiers. Each tier varies according to the specific risks of the equipment, the types of activities involved, and the critical safety barriers that protect against major incidents. Once defined, this KPI structure becomes the backbone of the process safety management system.
Think of this KPI system like a pyramid. At the top are the major incidents—the kind that must be avoided at all costs. And, at the base, are the smaller signals—subtle clues that safety systems may be weakening. But for this system to work, the KPI framework should be determined according to the priorities and barriers that each facility faces. That means making deliberate choices about which indicators to track, how they’ll be measured, and what thresholds will trigger action. Thus, the KPI tiers can be categorized within the following structure:
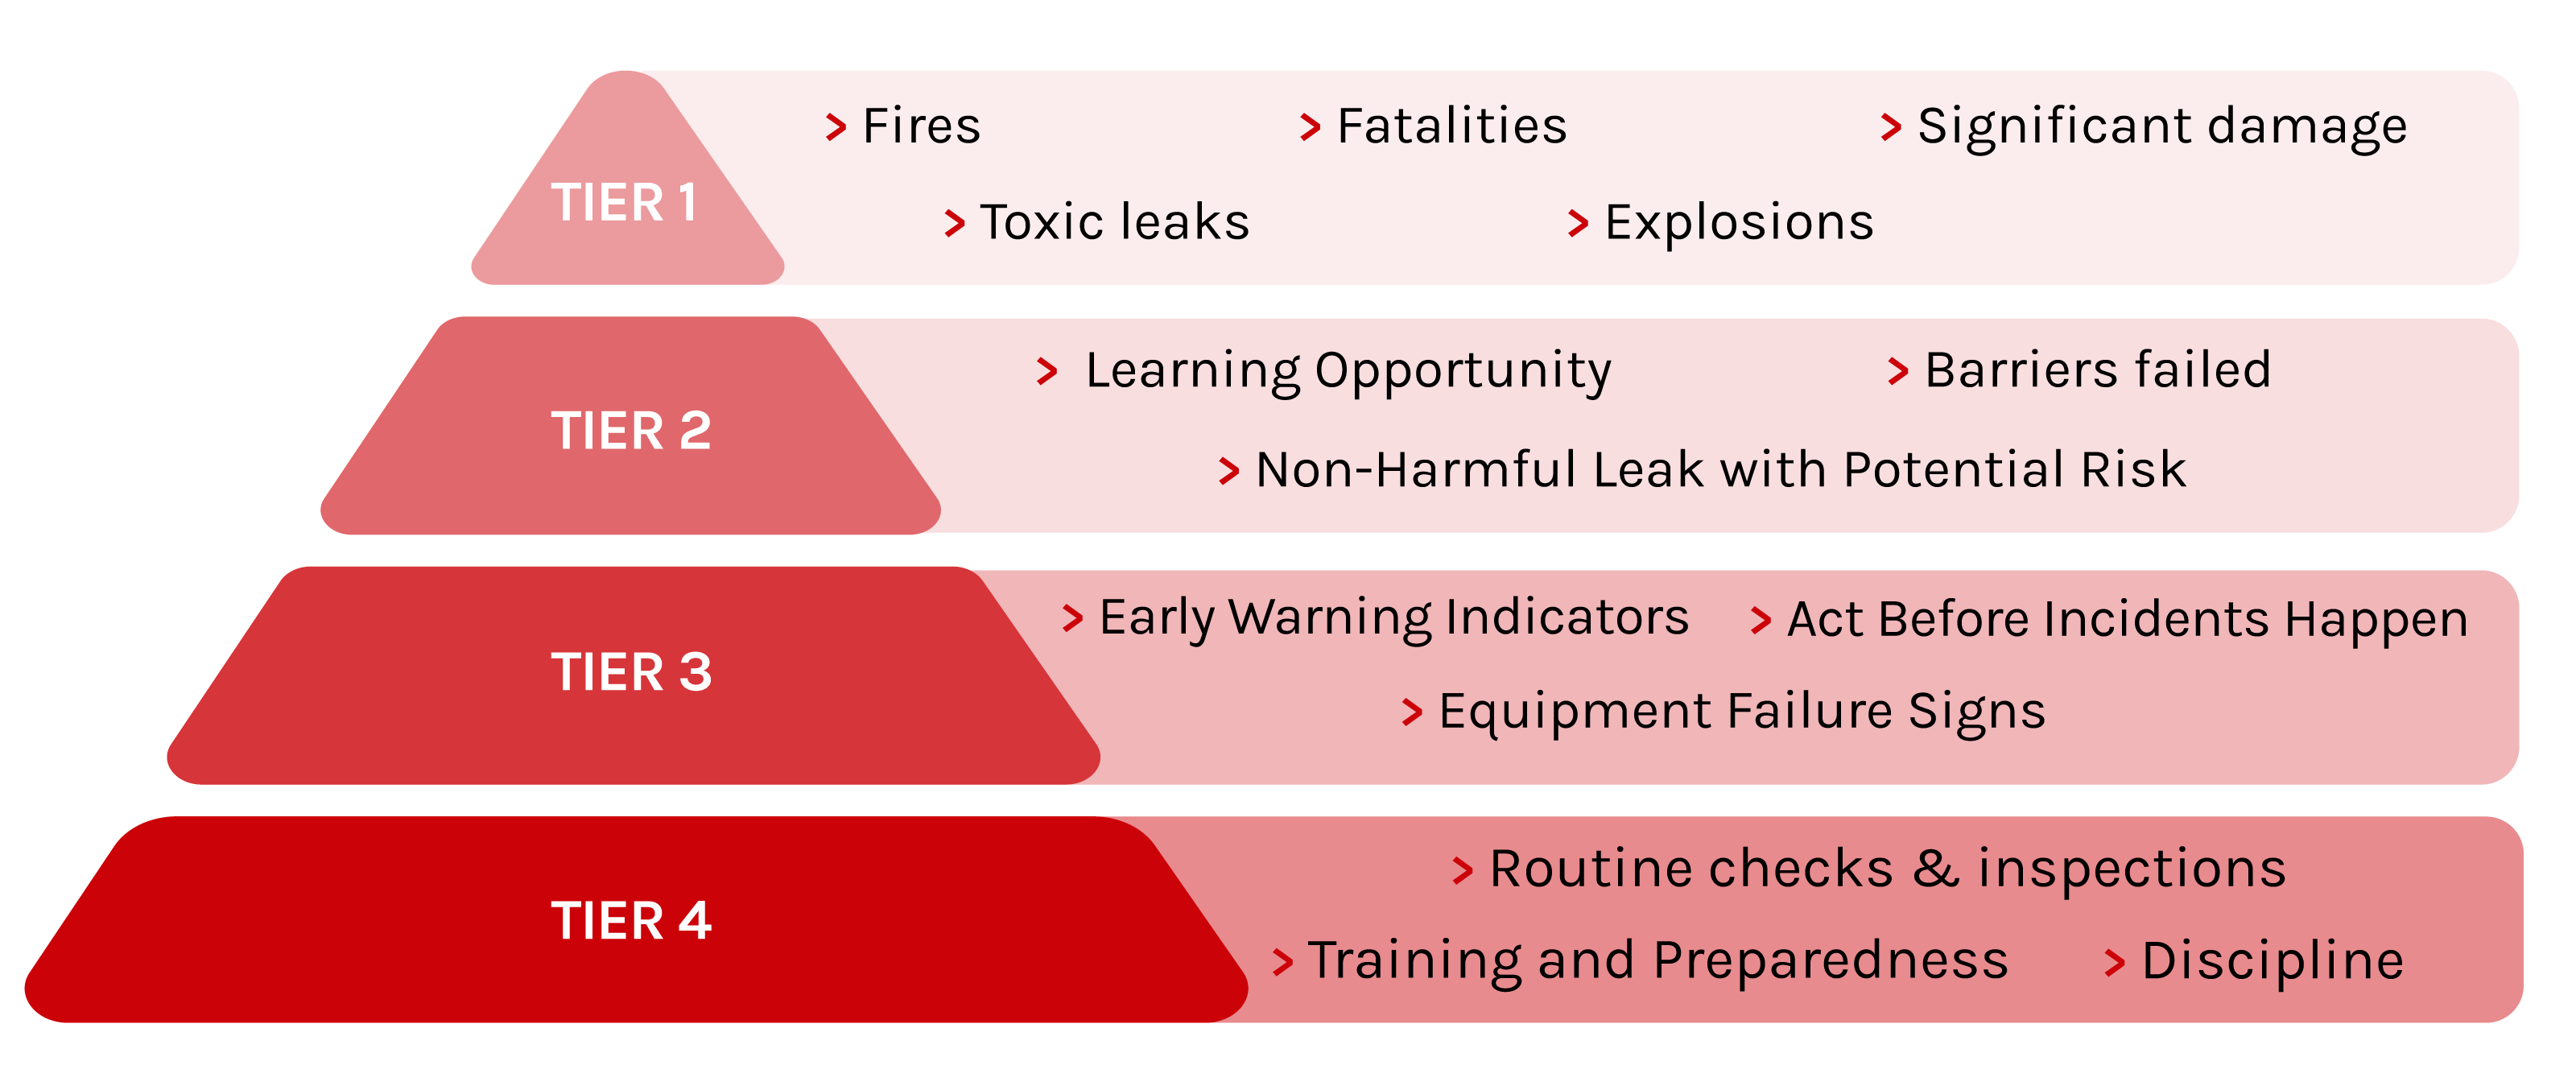
Tier 1
These refer to the worst-case scenarios—serious accidents like fires, explosions, or toxic leaks that cause injuries, fatalities, or significant damage. If a Tier 1 event happens, it means multiple barriers failed. It’s a clear signal that urgent corrective action is needed.
Tier 2
A Tier 2 event might be a leak that didn’t cause harm, but could have. These incidents suggest some barriers failed, but others kicked in just in time. They offer valuable lessons—if companies are paying attention.
Tier 3
These indicators catch early signs that a barrier isn’t working properly. For example, if a critical pump fails a test, or if a safety system is offline when it shouldn’t be. No one got hurt. Nothing exploded. But it’s a warning.
Tier 4
These are the checks, training, and routines that keep the whole system strong. Are inspections happening on schedule? Are operators following procedures? Are emergency drills being run? These might seem routine, but they are the foundation of process safety. Essentially, Tier 4 measures the behaviors and systems that keep Tier 3 barriers healthy, so that Tier 1 and 2 incidents never happen.
How Industry Leaders Manage Process Safety
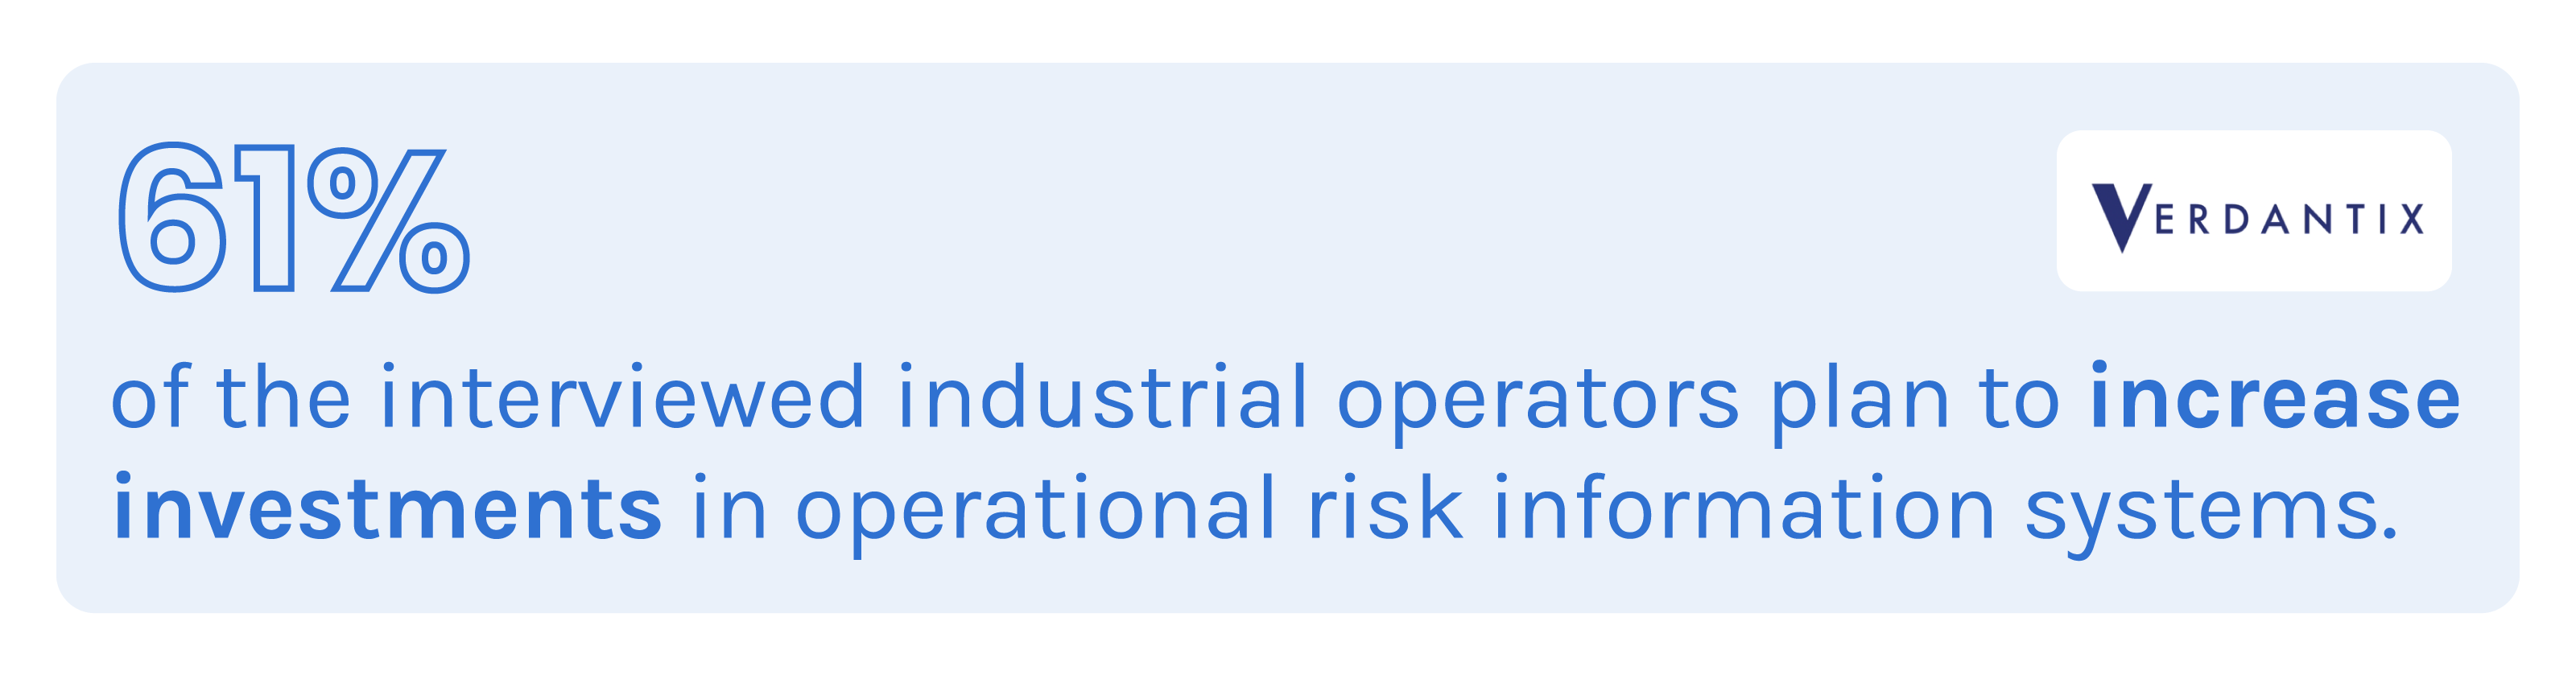
In leading energy companies, process safety is no longer treated as a static checklist—it’s a continuous practice deeply integrated into daily operations. At the heart of this proactive approach is the combination of field expertise with digital tools that provide real-time insights into asset conditions. Indeed, a Verdantix Survey stated that 61% of the interviewed industrial operators plan to increase investments in operational risk information systems.
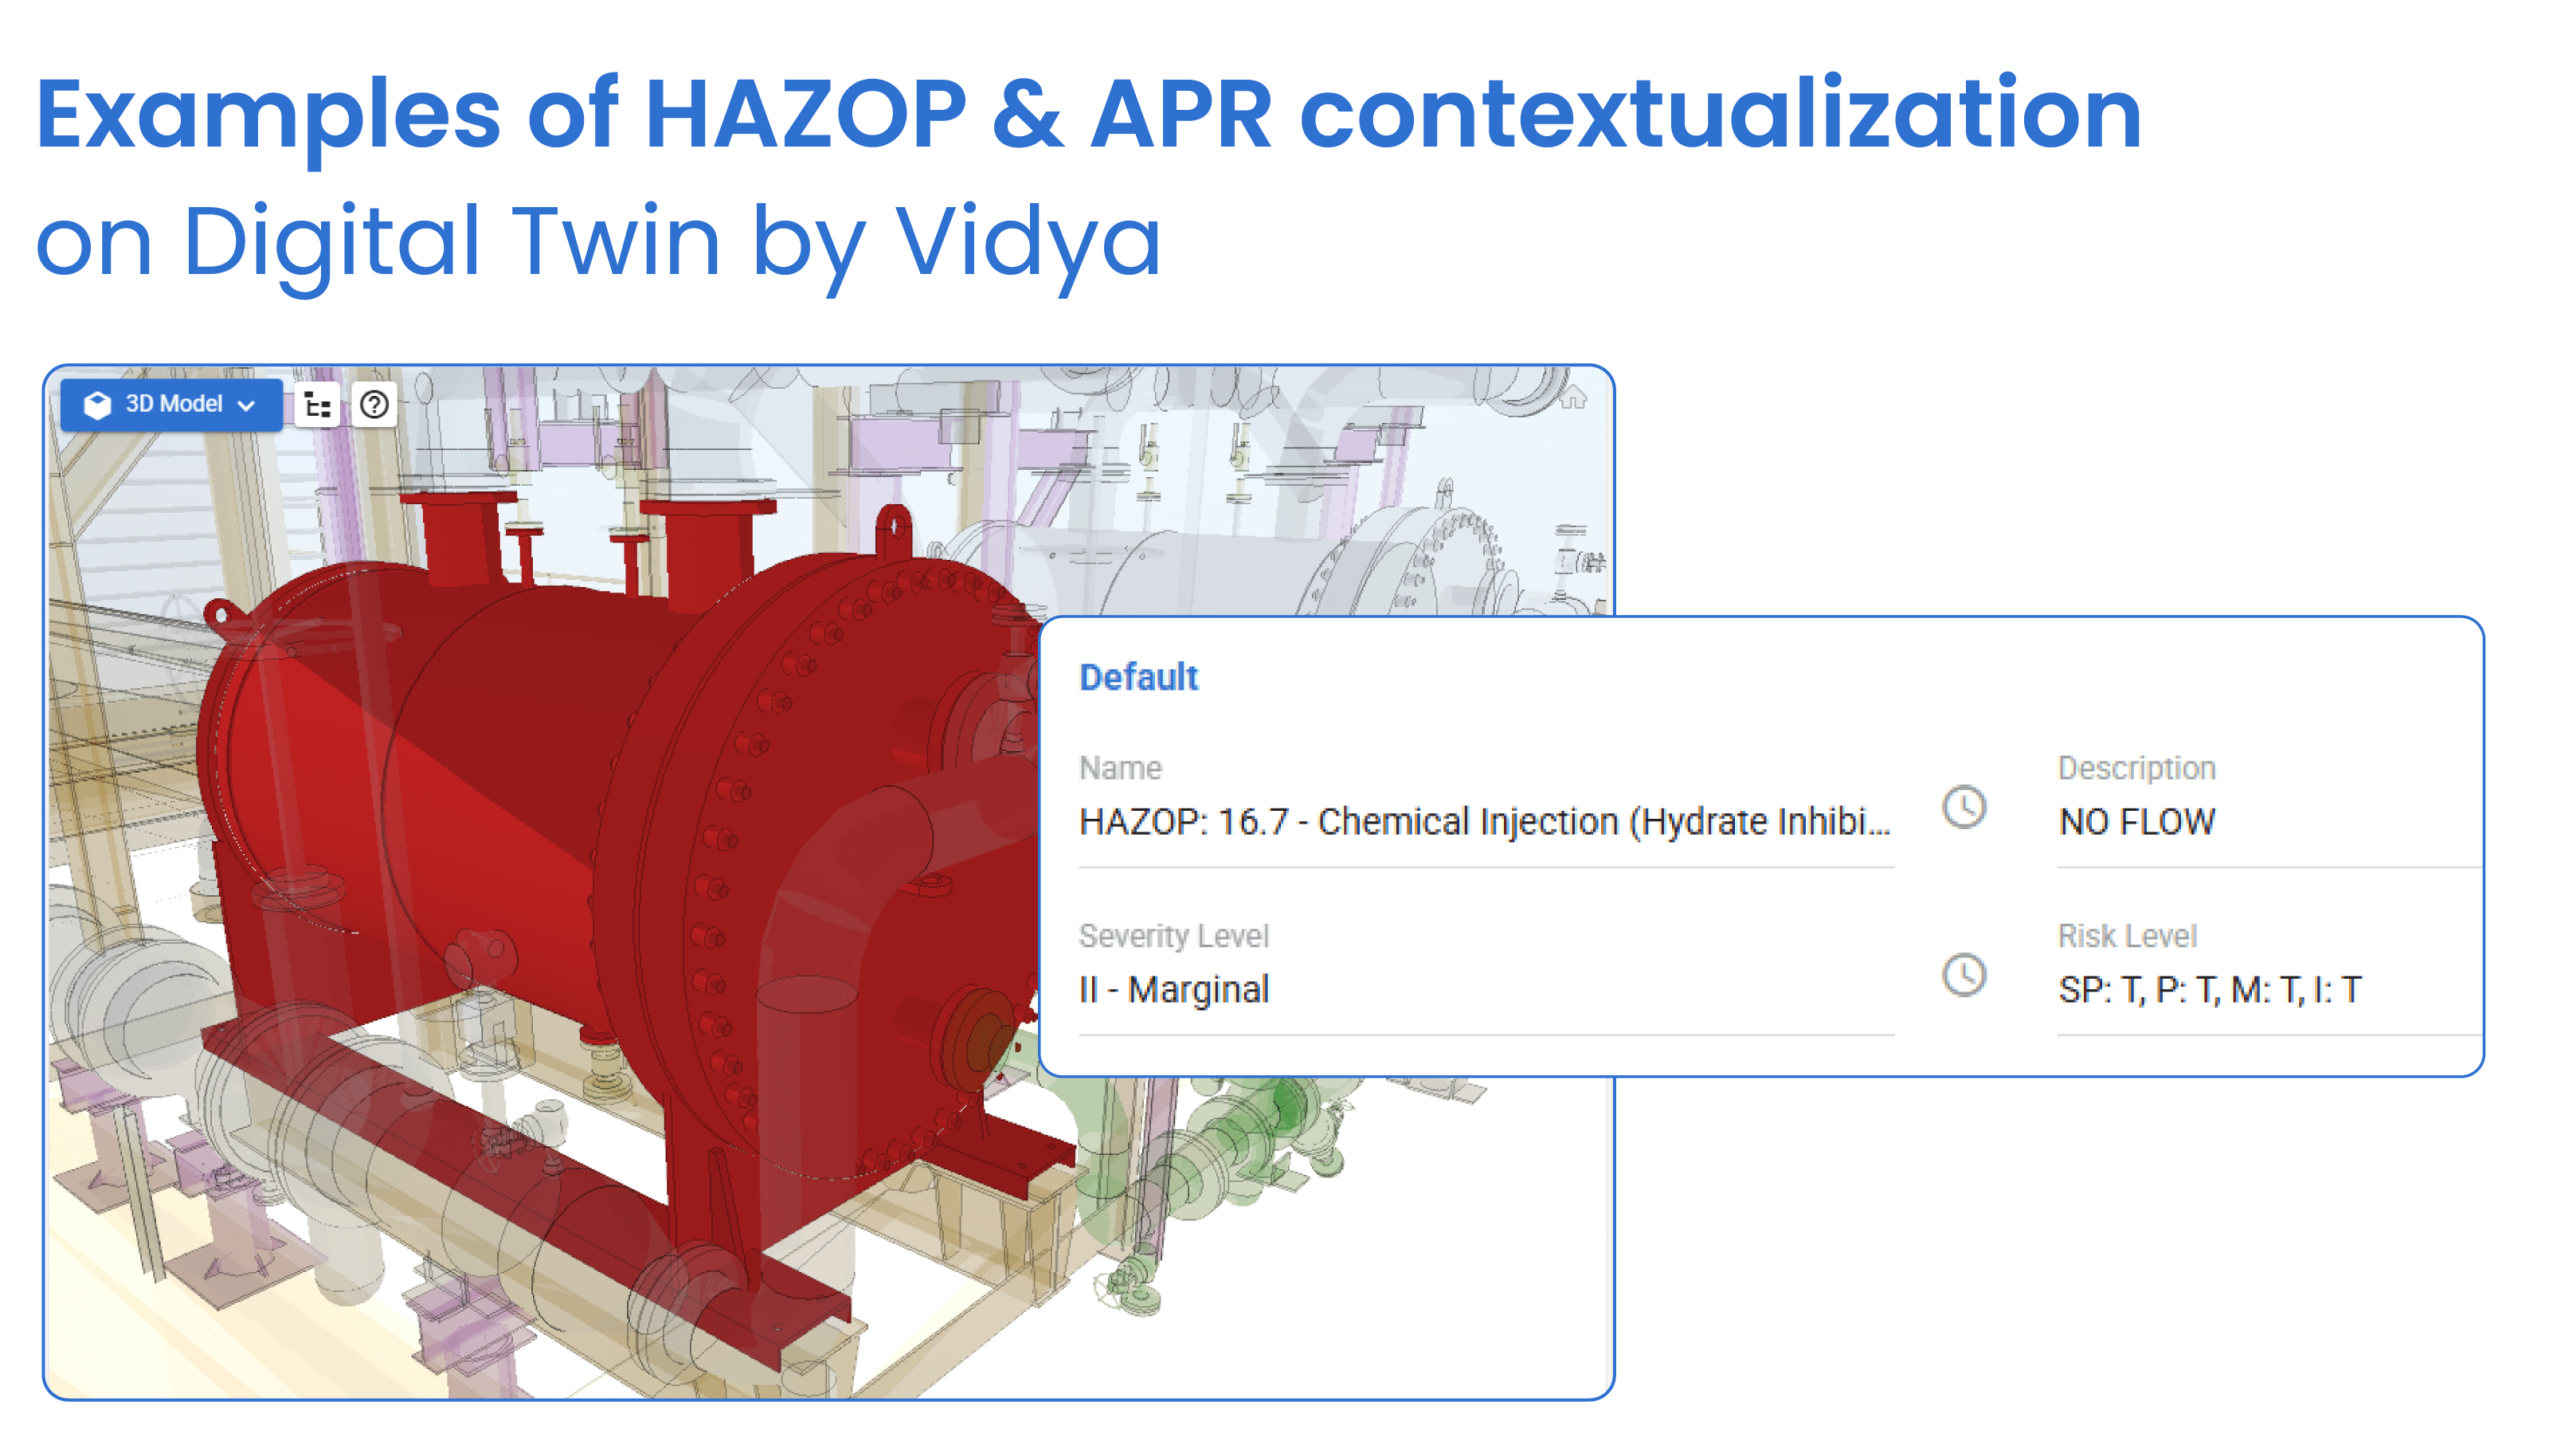
Field professionals, for example, now carry out process safety analysis by interpreting contextualized images of the facility and risk assessments, such as Preliminary Risk Analysis (PRA), Hazard and Operability (HAZOP), and Hazard Identification (HAZID) Studies. By comparing current visuals with historical inspection data and risk levels, they can track the progression of wear, corrosion, and other forms of deterioration that may represent a safety threat. This visual reference becomes a powerful tool to assess whether ongoing processes compromise operational safety or asset integrity. If the degradation trend shows signs of accelerating, teams can act early, before small weaknesses grow into major failures.
This digitized approach eases what used to be a rigid and demanding discipline. Where once multiple teams have been involved in crossing information of historical reports and risk assessments, now a single professional can validate visually through system-supported analysis. In these conditions, the safety professional compares the current state with past inspections, checks the historical behavior of degradation in specific areas, and determines whether repair, reinforcement, or preventive maintenance is needed.
Beyond image comparisons, these professionals leverage digital platforms to drive other critical process safety workflows:
- Creating reports that document the condition of assets and recommend actions;
- Drafting technical notes that communicate findings and mitigation plans;
- Managing MOC (Management of Change) processes, carefully analyzing every proposed change—whether equipment relocation, process alteration, or maintenance action—to ensure it doesn’t introduce new risks;
- Crossing and Updating Risk Assessments (PRA, HAZID, and HAZOP) with field findings to uncover potential deviations that could lead to safety incidents;
- Validating inspections with Bow Tie Analysis. By visualizing the “path” from a hazard to its possible consequences, professionals can identify weak spots in the safety system and prioritize where to strengthen controls.
In these conditions, process safety is evolving into a discipline that reduces the need for professionals to be physically present in the field for every inspection. By leveraging contextualized images, risk assessments, corrosion history, and inspection data through digital platforms, safety teams can perform much of their analysis without being onboard. This shift doesn’t eliminate the role of field visits—it refocuses them. Instead of routine presence, professionals now go on board for targeted, quick checks and cross-verifications, ensuring that digital findings align with on-the-ground conditions.
Through these platforms, safety professionals can prepare reports, review inspection records, and visually assess elements with potential risks—all without leaving their desks. This approach minimizes unnecessary personnel on board (POB), allowing teams to detect deviations and recommend actions faster. As a result, process safety becomes a more agile, continuous practice that strengthens both operational safety and asset integrity without the burden of constant field deployment.
Conclusion
This evolution in process safety management marks a turning point for the energy industry. By combining structured KPI frameworks with digitally enhanced practices, companies are no longer limited to reacting to failures—they are actively shaping safer, more resilient operations every day. As barriers are monitored in real time, and process deviation is spotted before it escalates, operational safety becomes less about controlling damage and more about sustaining performance.