Industrial assets generate an overwhelming volume of integrity-related information: inspection reports, anomaly registers, corrosion assessments, and maintenance logs. When managing this data, everything is recorded, archived, and often compliant with internal processes. Still, when decisions need to be made, teams frequently return to the same question: where exactly is the problem located, and what does it affect?
Why integrity is a spatial problem
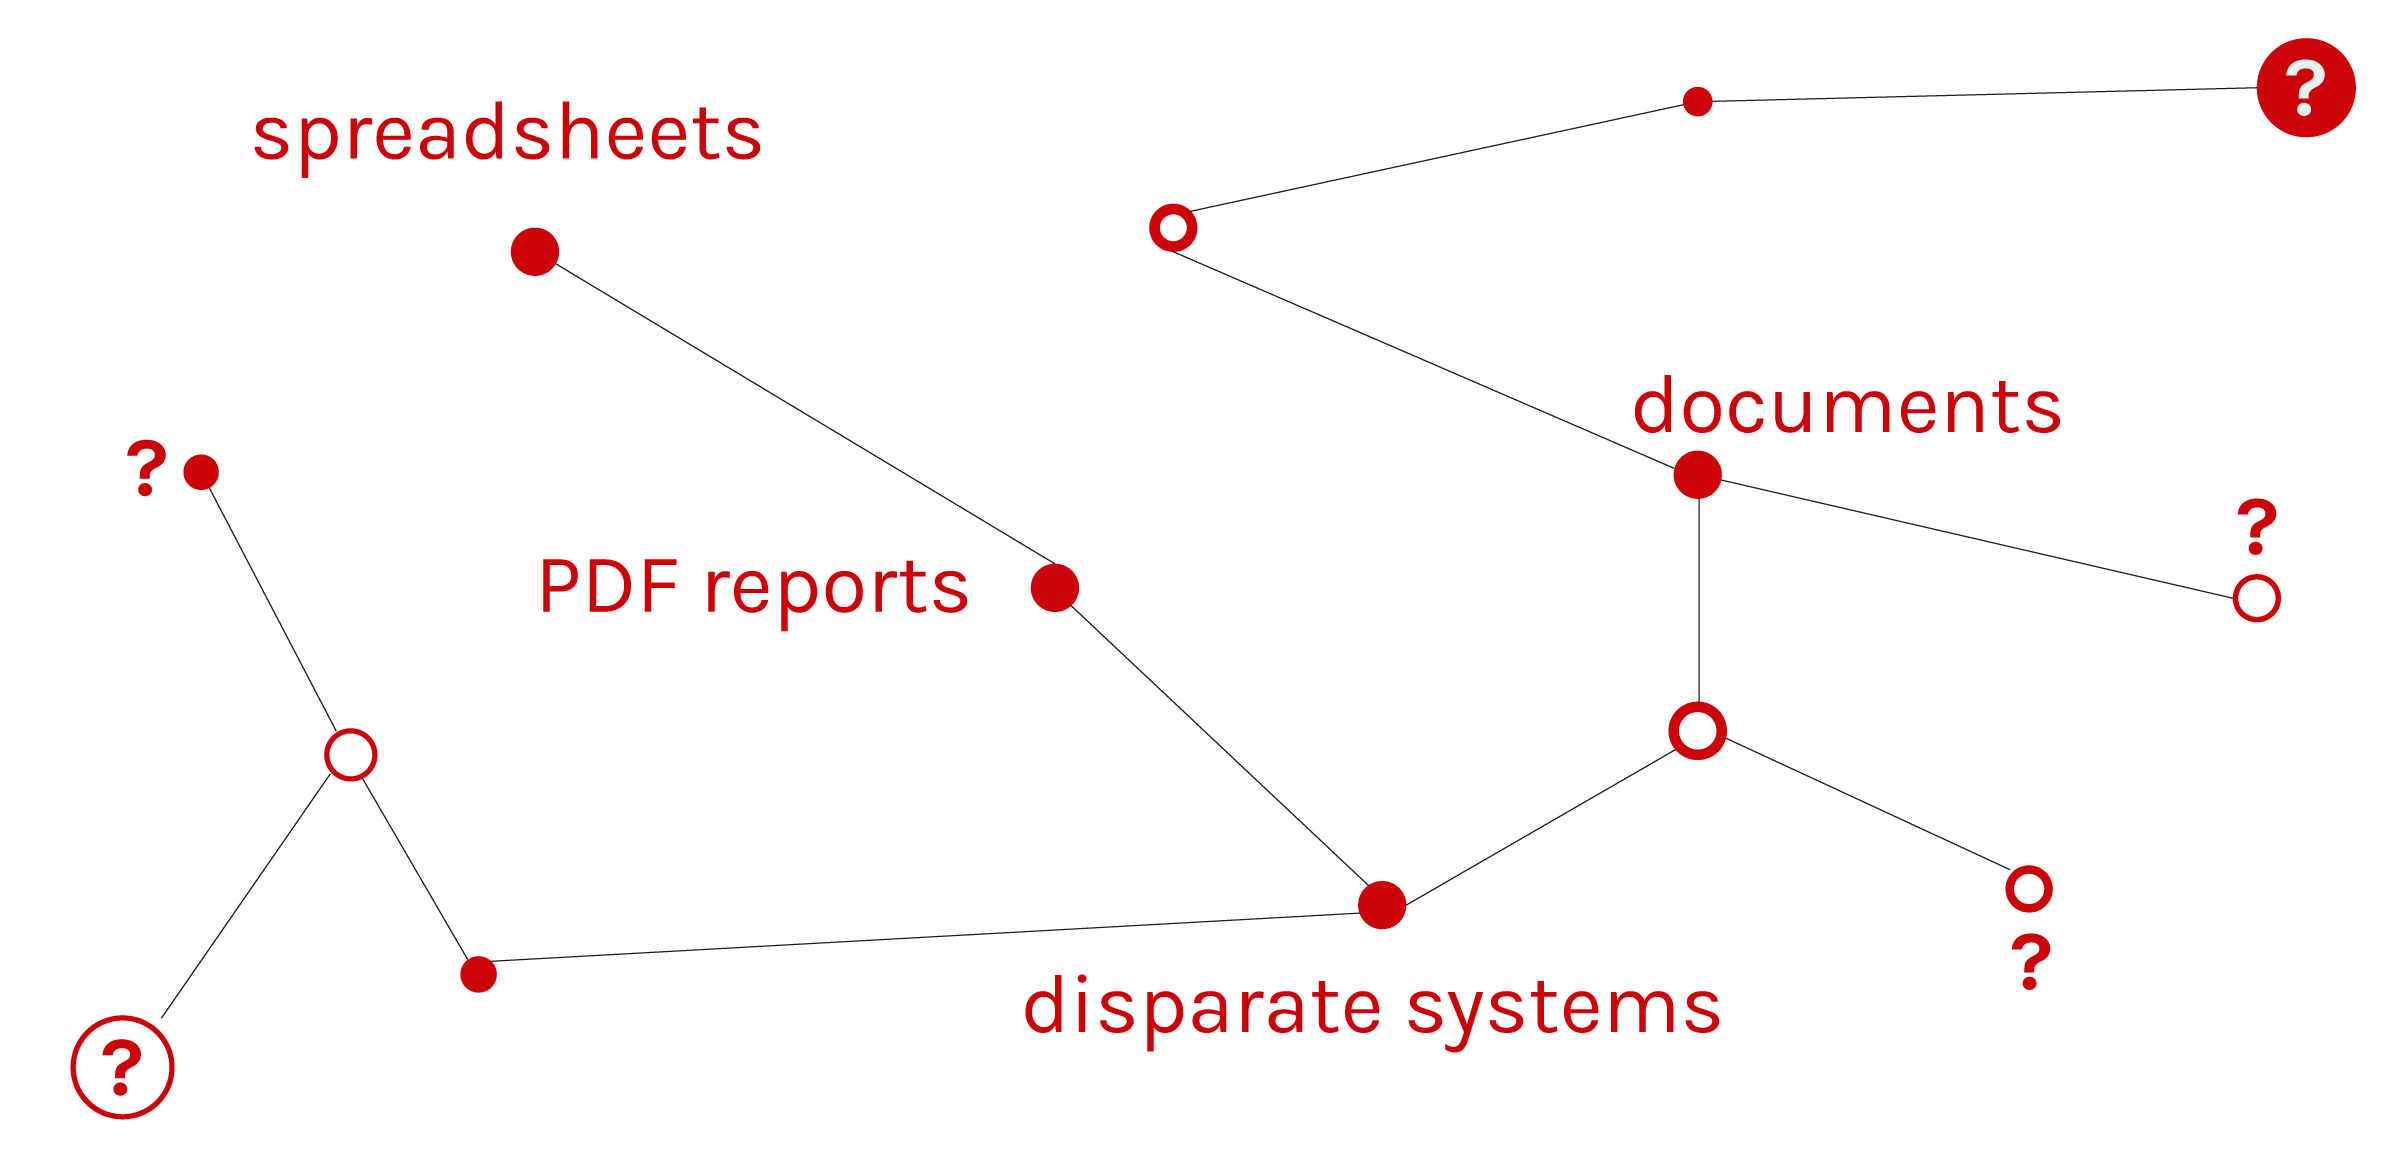
Integrity does not exist in isolation. Every anomaly is tied to a specific location, a piece of equipment, a line segment, or a structural component. Its criticality depends not exclusively on severity, but also on proximity, accessibility, interdependencies, and operational context. A small corrosion point, for instance, may appear insignificant when analyzed through spreadsheets, but its relevance changes entirely when positioned near critical systems, high-risk areas, or components with limited accessibility.
When this spatial dimension is missing or diluted, integrity becomes abstract. That corrosion point described in a spreadsheet carries far less meaning than the same issue visualized within the system it belongs to. Without spatial clarity, teams are left to reconstruct context mentally, often relying on fragmented references, outdated drawings, or field validation. This is where inefficiencies begin to compound.
Traditional approaches to integrity management
Most integrity management approaches are built around two parallel efforts: structuring data and controlling inspection activities. On one side, companies invest in organizing engineering records, inspection histories, and operational inputs into connected datasets. On the other hand, they implement standardized workflows (inspection plans, checklists, and testing routines) to ensure that asset conditions are systematically verified and recorded.
Together, these approaches improve consistency, traceability, and operational control. However, they are not designed to represent the asset as it exists in physical space. Still, whether analyzing a dataset or reviewing an inspection result, understanding its real impact still depends on reconstructing its position within the asset.

Organizing and connecting integrity data
The most common approach focuses on connecting fragmented sources such as engineering records, inspection histories, and operational inputs into structured datasets that can be navigated and queried. It allows information to be linked to equipment, systems, and processes, creating consistency across different sources.
This improves accessibility, but the context remains primarily relational. A corrosion record tied to a line number or a thickness reading associated with a component still requires interpretation to understand where that element sits within the asset. The user must translate tags and hierarchies into a mental representation of the field. Core engineering information, such as process diagrams, technical datasheets, and user manuals, remains fragmented and heterogeneous in the form of 2D documents and 3D drawings (Rasys, E. et al., 2014). Information may be contextualized, but not in a structure that supports rapid synthesis or validation, increasing dependence on manual interpretation and cross-referencing.
In this process, spatial relationships are not explicit. Proximity between components, shared exposure conditions, or constraints in access are not directly visible. The data is connected, but not positioned.
Inspection management
The second approach, inspection management, structures how activities are planned, executed, and tracked over time. In practice, this is largely driven by predefined routines: inspection plans, checklists, and testing procedures assigned to specific components or systems. These workflows ensure that required verifications are completed, results are recorded, and compliance is maintained.
Tags, equipment hierarchies, or maintenance schedules typically trigger activities. A technician follows a checklist, validates conditions, records measurements, and moves to the next item. The process is controlled and repeatable, but the spatial context of each action, where it happens, what surrounds it, and what constraints exist, is not inherently part of the workflow.
As a result, the interpretation of findings remains detached from execution. A failed measurement or identified anomaly is logged against a component, but understanding its relevance often requires reconstructing its position within the asset. Whether that component is located in a congested area, near critical systems, or within a zone of recurring issues is not immediately visible from the activity itself.
How 3D Spatial Reconstruction Strengthens Asset Management
Even when data is properly contextualized, and inspection activities are consistently executed, a fundamental element is still missing: precise spatial reference. Without it, information remains tied to TAGs and reports, but not to the asset as it physically exists.
Georeferencing becomes critical at this point. It allows every piece of integrity data, anomalies, inspection results, and measurements to be anchored to an exact position. This is what enables teams to move from identifying which component is affected to understanding how it relates to the rest of the asset.
This spatial foundation is built through reality capture and 3D reconstruction processes. Laser scanners, drone images, 360º photos, and other capture methods collect millions of spatial points directly from the asset, generating representations of its geometry with high fidelity. These datasets are then processed, aligned, and consolidated to reconstruct a coherent 3D model that reflects the asset as it currently exists in the field.

Within this environment, an anomaly can be evaluated in relation to nearby systems, a measurement can be understood within its physical constraints, and inspection histories can be read directly on the asset. What previously required interpretation across multiple sources becomes directly observable.
This shift is not only about visualization. It establishes a consistent spatial reference that connects data, activities, and asset condition into a single environment. The next step is extending this foundation beyond static representation, ensuring that this spatial context remains continuously aligned with the asset and integrated into ongoing operations.
Digital Twins
Digital Twins extend this concept by integrating spatial reconstruction with continuously updated operational and integrity data. They are not static models. Their value comes from maintaining alignment between the digital representation and the real asset over time. When properly implemented, they allow different disciplines, inspection, maintenance, engineering, and operations to interact with the same environment, each accessing the layer of information relevant to their role.
This shared reference reduces discrepancies between teams. Instead of multiple interpretations derived from separate systems, decisions are based on a common, spatially grounded view of the asset.

Vidya’s Spatial Approach for Integrity Management
Individually, data contextualization, activity management, and spatial reconstruction address different aspects of integrity. One structures information, another organizes execution, and the other anchors both to the physical asset. In practice, however, these elements are often implemented separately, forcing teams to move between systems to interpret, validate, and act on information. Vidya’s approach is built on eliminating that separation.
It integrates contextualized data, spatial computing, inspection and maintenance activities, and georeferenced spatial models into a single environment where all elements are directly connected. Engineering data, anomaly records, inspection histories, and operational inputs are not only linked through asset hierarchies but also positioned within an accurate 3D representation of the asset.

This integration is supported by large-scale data processing pipelines that consolidate and align heterogeneous inputs (reality capture datasets, documentation, and structured engineering records) into a consistent spatial framework. What would traditionally require extensive manual correlation is handled continuously and with minimal intervention, allowing the environment to remain up to date as new data is introduced. By anchoring data to its exact location and making it accessible across disciplines, Vidya helps teams build a consistent, shared understanding of asset condition.
With this approach, what was previously interpretative becomes explicit. Teams can immediately understand where an issue is, what it affects, and how it relates to surrounding systems. For instance, it is possible to evaluate how an intervention needs to be performed. Access conditions, surrounding constraints, and elevation differences can be assessed remotely, allowing teams to determine whether a task requires simple access equipment or more complex setups such as scaffolding, as well as how that intervention should be executed.
This eliminates repeated validation cycles and introduces a more direct way of interacting with asset data: one where spatial computing enables users to navigate, assess, and act within the environment itself. Indeed, according to Gartner’s 2025 trend list, “Spatial Computing” entered enterprise roadmaps as a key frontier for human-machine synergy.
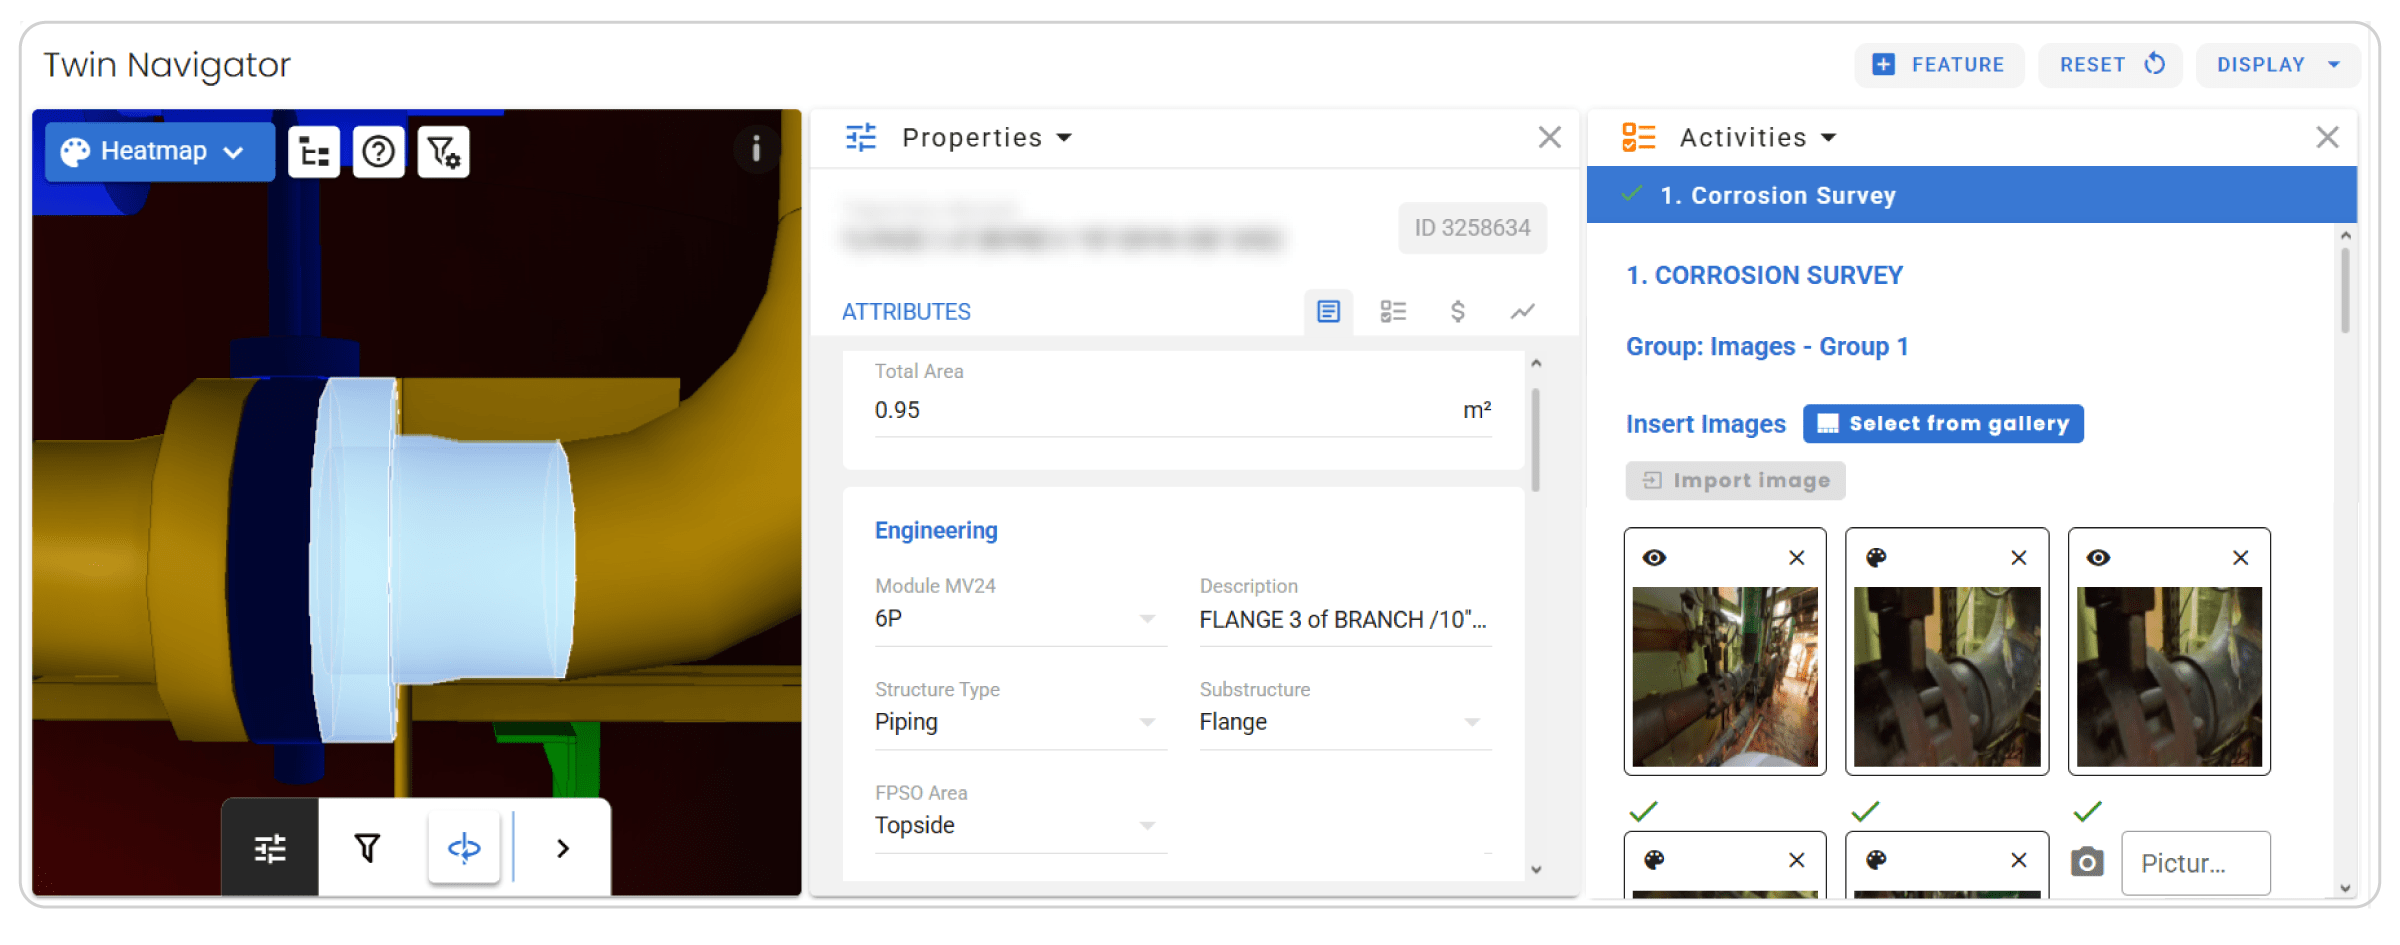
“I use Vidya’s system as a direct support tool for anomaly management. Through the 3D plant visualization, I can clearly identify the exact locations and components that require field verification. I often receive internal requests related to failures or improvement opportunities, and I rely on the VSP to assess actual field conditions before any team is mobilized.” — Process Engineer & VSP user, 2025
The result is not just improved visibility, but a shift in how integrity is managed. Instead of navigating between systems to assemble meaning, teams operate within a unified environment where data, activities, and asset condition are continuously aligned.

The step forward: Ora Viewer
Ora Viewer builds on this integrated foundation by introducing a photorealistic representation of the asset as the primary interface for accessing data and managing integrity.
Using spatial computing and reality capture techniques, it reconstructs the environment from high-resolution images and geometric data, generating a 3D space that preserves visual detail with high fidelity and extends the capabilities of a traditional Digital Twin. The Ora Viewer operates as a visual and contextual layer on top of Digital Twin infrastructures, where structured data and operational records are embedded directly into the reconstructed environment.

For integrity management, this creates more than a visual model. It provides a three-dimensional snapshot of the asset’s condition at a specific moment in time, cross-referenced with the Digital Twin and the underlying data foundation that supports it. Inspection findings, degradation records, and maintenance history can be viewed in relation to the exact physical state of the asset when that information was captured.
As new capture cycles are introduced, these spatial records can be compared over time. Changes in surface condition, structural deformation, corrosion progression, or intervention history can be evaluated within the same environment, allowing teams to understand how that space is evolving.
This shifts the role of the interface. It is no longer a layer that requires translation, but one that reflects the asset with enough detail to support direct evaluation. For integrity teams, this means decisions can be made based on visual evidence aligned with structured data, reducing the need for assumptions or repeated field validation.
Conclusion
Industrial operators struggle with integrity management because they are trying to solve a spatial, three-dimensional problem using 2D tools that reduce the asset to diagrams, tables, and reports. The physical context where issues exist is not directly accessible; it has to be reconstructed through interpretation.
As assets become more complex and data continues to grow, the limitation is no longer access to information, but the ability to interpret it in a way that reflects reality. Integrity depends on understanding how each element fits within the physical environment, how it interacts with surrounding systems, and how it influences decisions in practice.
Approaches that treat data, activities, and asset representation separately fall short of this requirement. What emerges instead is the need for a model where these elements are aligned, spatially grounded, and directly accessible. When that alignment is achieved, the original question changes. Instead of asking where a problem is and what it affects, teams can immediately see it, evaluate it, and act with confidence.